University releases 2015 Campus Climate Survey
Survey results slide into public view after year of data organization
More stories from Gabriel Lagarde
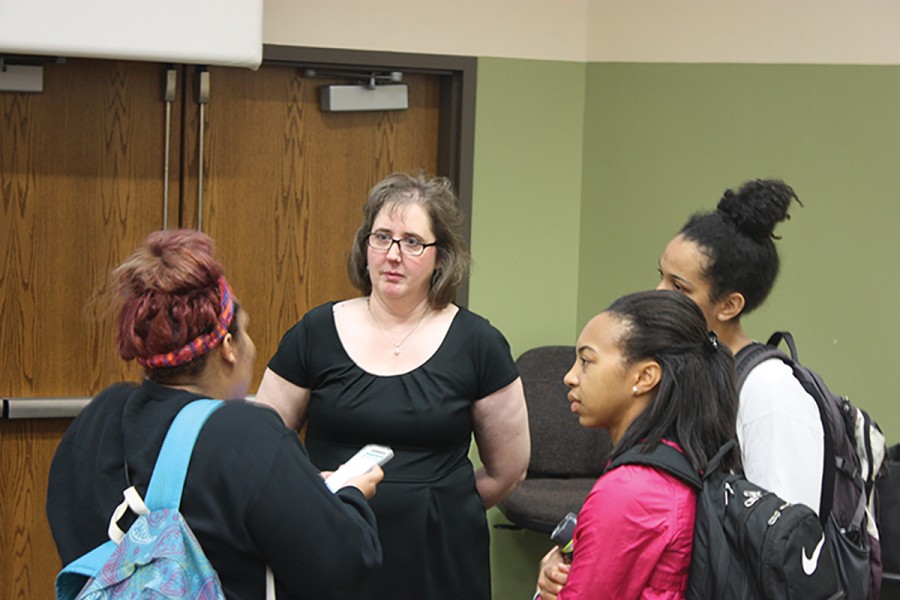
Photo by Gabriel Lagarde
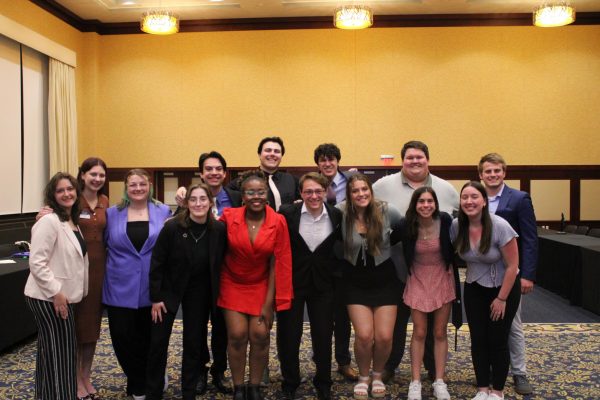
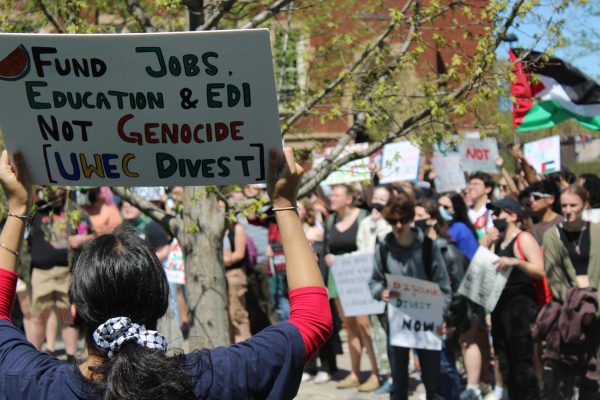
More than other campus-wide initiatives, such as the 2008-2016 Centennial Plan, the UW-Eau Claire administration has made a concerted push to foster a campus grassroots discussion and incorporate feedback from the larger Eau Claire community into implementing its EDI goals. Photo from Spring, 2016 EDI Forum.
Over 28 percent of UW-Eau Claire students have faced instances of discrimination on campus.
That’s only part of a host of statistics revealed at a forum Tuesday afternoon as campus leaders discussed results from the 2015 Climate Survey.
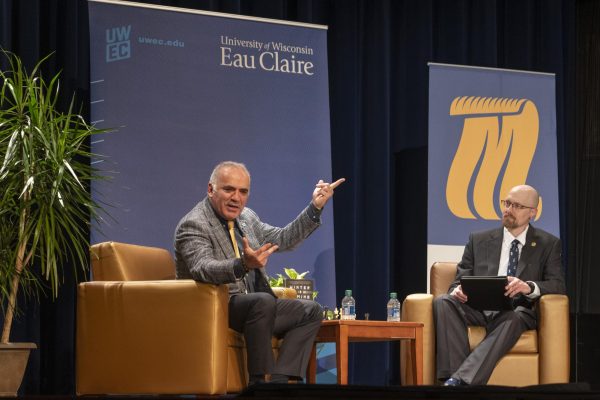
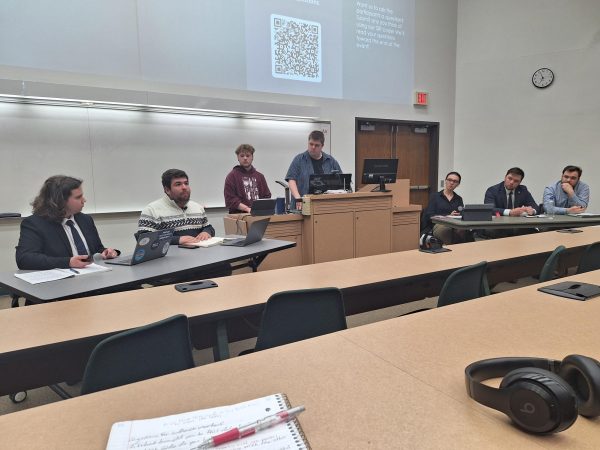
Equity, Diversity and Inclusivity Fellows Melissa Bonstead-Bruns and Jeff Goodman presented results in Schneider Hall to an audience of about 80 people. The EDI fellows took comments and answered questions regarding the data and how it pertains to the cultural atmosphere on campus.
Since its inception in 2013, the creators of the 2015 Climate Survey sought to improve upon the 2009 edition, said Goodman, an associate professor of psychology. There were many questions from the 2009 Climate Survey that were not applicable to the target date, were too general, did not pertain to specific circumstances or were not tailored to UW-Eau Claire’s situation, he said.
“We wanted a survey that reflected the needs of the campus,” Bonstead-Bruns said, “and so we sought out a lot of input.”
The 2015 Climate Survey has been a work in progress since its proposal in 2013. It was a vast, time-consuming gathering of information that included the responses of 3,168 students and 779 campus employees in regards to diversity on campus, said Bonstead-Bruns, a professor of sociology. The Climate Study Committee quantified this information into data-sets, each featuring over 500 variables.
The survey, conducted between February and March 2015, asked participants to indicate their views on categories including overall climate, incidences of bias, sexual assault or access and accommodation for individuals with disabilities. Many of the questions featured a 1-5 scale, with 1 being the lowest or most positive end and 5 being the highest or most negative end of the spectrum.
Here are some notable pieces of information, according to the survey results PDF file:
— Among students, people of color, LGBTQ and international students were overwhelmingly the top three groups that expressed the highest levels of discomfort in the climate portion of the survey.
— Among faculty, people of color, LGBTQ and women were predominantly the top three groups that expressed the highest levels of discomfort in the campus climate.
Another conclusion from the study was the disparity between LGBTQ students and LGBTQ employees within the context of their own departments, Goodman said. Employees reported to be the most comfortable demographic while students rated among the top three demographics reporting higher levels of discomfort in the same category.
“For employees it looks like this is a great campus for everyone except people of color,” Goodman said, “but, it looks like your experience as a student is quite different depending on your group membership. That (data) makes it almost look like two different populations.”
— Incidences of bias, which include categories like threats/intimidation, being stared at, derogatory remarks and racial profiling, were reported among 67.2 percent of people of color, 35.1 percent of women, 68.1 percent of LGBTQ and 56 percent of students with mental health disabilities.
— For incidences of bias reported among employees: 40.1 percent of all employees, 74.1 percent of people of color, 44 percent of women and 48.6 percent of LGBTQ.
— Of student respondents, 4.5 percent indicated they had been the victim of sexual assault or attempts of sexual assault.
— Of the 124 students that reported instances of sexual assault, 60 percent lived off-campus while 34.7 percent lived in the residence halls. The remaining 5.3 percent had other living arrangements.
— 34 percent of students with disabilities reported working with instructors who were resistant to providing accommodations while 21.3 reported working with instructors that refused or made the process too difficult to be practical.
— Only 28 percent of students with disabilities indicated residence halls were “accessible” or “very accessible.” Class labs and studios (47.1 percent) and classrooms in general (54.1 percent) round out the bottom three for campus buildings and services.
Nathaniel McFarland, a junior geology student, said many students and faculty are slow to acknowledge negative aspects of the campus.
“There might be a personal reluctance to give up hope,” he said. “They don’t want to come to terms with the fact that this is a really bad environment, for anyone going into it they would expect it to be a negative environment for them.”
Full results are available on the university website.